
Housing Isn't Broken — It's Frozen
Prices sit near record highs while sales languish at 1995 levels. That's not a crash. It's a market where almost nobody can afford to move.
Bottom Line Up Front
Everyone keeps waiting for the housing market to crash or recover. It's doing neither. It froze.
Existing-home sales ran at a 4.09 million annual pace in June 2026, per the National Association of Realtors; 2025's full-year total was the lowest since 1995, in a country that has added roughly 70 million people since. By Redfin's count, only 28 of every 1,000 homes changed hands last year — the lowest turnover in decades.
Prices, meanwhile, barely budged. The Case-Shiller national index touched a record high this spring, even as annual gains slowed to under 1% and prices fell in inflation-adjusted terms.
Prices near records, sales at thirty-year lows — that tension is the most important fact in American housing. This report explains the freeze; four companions cover the moving parts: the lock-in that causes it, the builders who route around it, the Sun Belt where it's thawing, and the shortage underneath it all.
The street where nobody moves
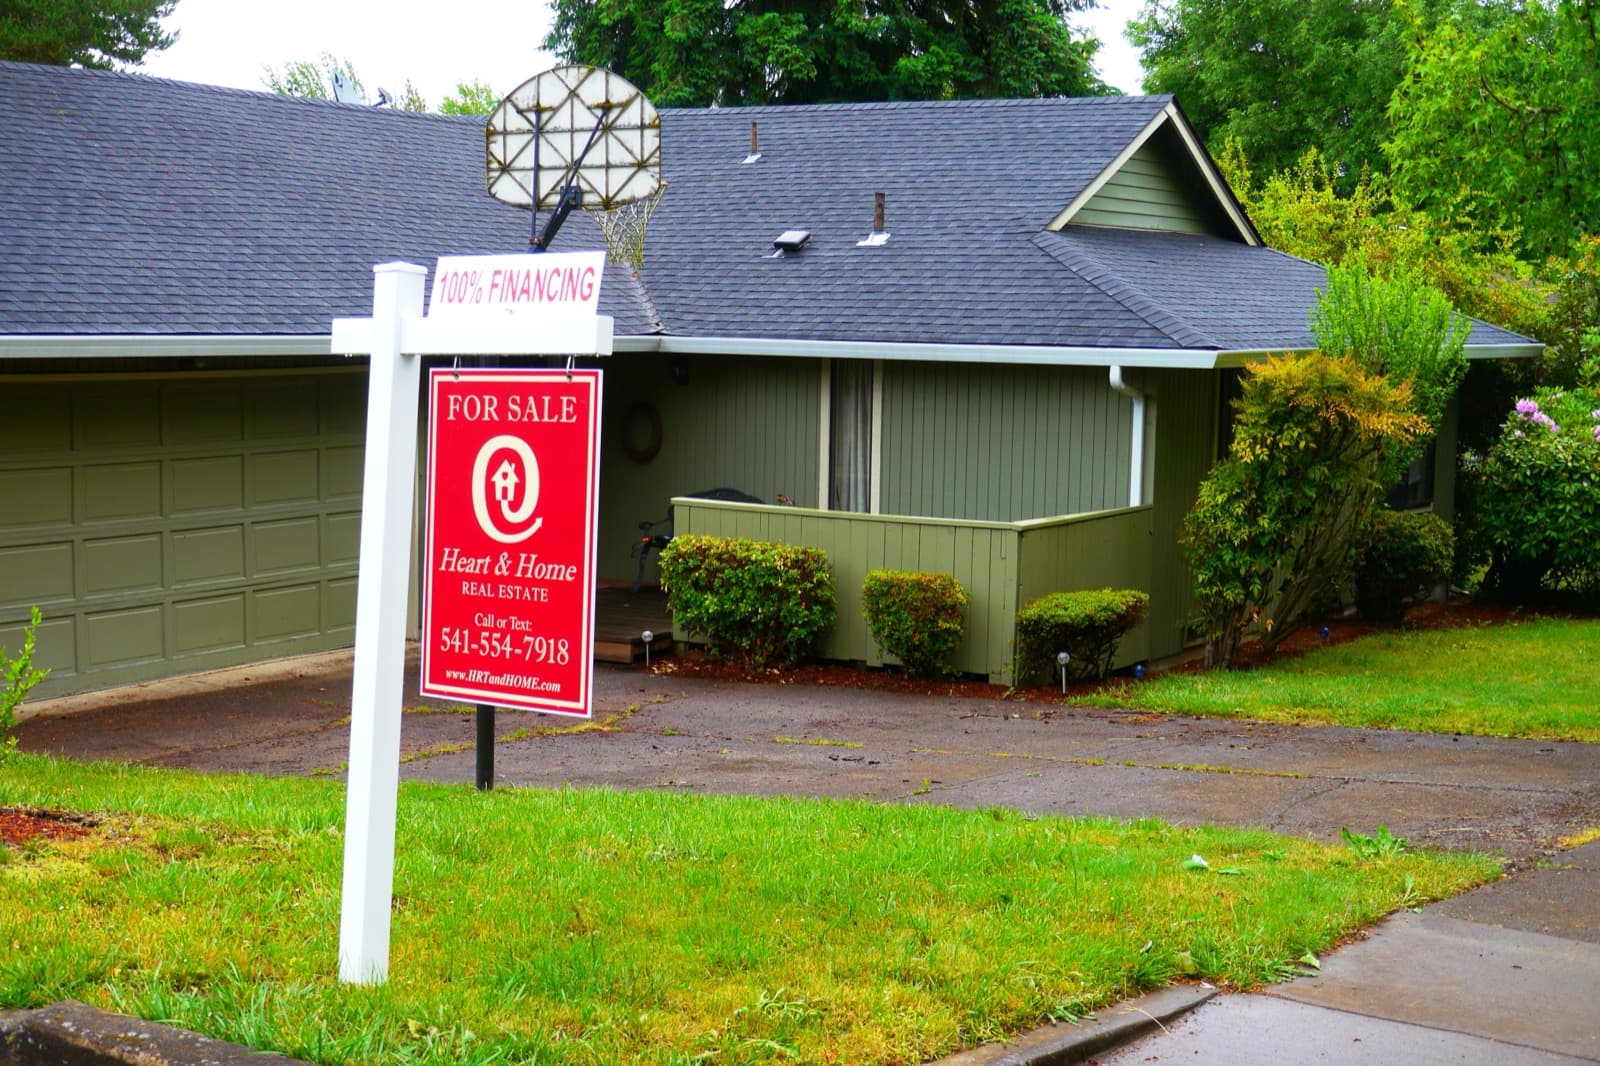
Walk a pleasant suburban street this summer and count the for-sale signs. You won't need many fingers. The lawns are mowed, the schools are full, values are up. And almost nothing is on the market.
A housing crisis is supposed to look like 2008 — foreclosures, empty houses, falling prices. This one looks like nothing happening. The dysfunction isn't what homes cost; it's that nobody's trading them.
Here's the plain-English way to see it: a housing market has two prices. The price of houses, which everyone watches. And the price of moving — the cost of swapping the mortgage you have for the one you'd need. From 2022 on, the second price exploded while the first stood still. A family with a 3% pandemic mortgage moving across town into an identical house at today's 6.6% would pay hundreds more per month for the same borrowed money. So they don't move. Multiply by tens of millions of households and you get a market that's fully priced and barely trading.
Economists would say transaction volume collapsed while prices stayed sticky. A simpler version: it's musical chairs where the music stopped and everyone found a chair — and now nobody dares stand up.
The numbers behind the freeze
Sales of existing homes peaked above six million a year in 2021, fell by roughly a third, and stayed there — 4.06 million in 2025, barely different in 2024, a 4.09 million pace this June. Inventory has recovered to about 1.56 million homes and 4.6 months of supply, but much of it sits: sellers anchored to 2022 prices, buyers priced out by 2026 rates, and Freddie Mac's 30-year fixed at 6.58% in late July.
And the frozen part is specifically the resale market. New construction kept transacting — builders can cut prices and buy down mortgage rates in ways an existing owner never will (that mechanism gets its own report). The FHFA's National Mortgage Database explains who's holding still: roughly half of outstanding mortgages carry rates under 4%.
Why do prices stay high if demand fell? Because supply fell with it — every discouraged buyer is also a seller who never lists. Both sides withdrew together: volume collapsed, price barely moved. A freeze, not a bust.
A cardinal knows the difference between a dead forest and a January one. The winter woods look finished — no motion, no sound — but the trees are alive, waiting for conditions to change. Housing in 2026 is a January forest. Prices tell you the trees are standing. Volumes tell you it's winter.
Now trace the chain outward, because a frozen housing market doesn't stay a housing story. Treasury yields set mortgage rates; mortgage rates set the price of moving; the price of moving sets transaction volume — the revenue line for realtors, lenders, title firms, movers, and the renovation spending that follows every purchase. Deeper still: workers who can't afford to move can't chase better jobs, which quietly gums up the labor market itself.
Key Judgments
- The defining feature of this cycle is collapsed volume, not falling prices — and it should persist as long as the gap between outstanding and prevailing mortgage rates stays wide.
- A traditional price crash remains unlikely without a labor-market shock — forced selling, the fuel of 2008, is largely absent. Erosion in real prices is the likelier valve.
- The freeze thaws gradually, not suddenly: through slowly rising inventory, life-event moves, and builder supply, rather than a single rate-cut moment.
- Regions are diverging. Supply-friendly Sun Belt metros are thawing first — more listings, flat-to-falling prices, more sales — while tight coastal markets stay frozen longest.
Risks & Counterarguments
The honest case against "frozen, not broken": maybe the ice is thinner than it looks. Inventory is climbing in Texas and Florida, new-home supply is glutted, and national real prices have already been falling for about a year. If listings keep rising while buyers stay sidelined, "frozen" quietly becomes "falling," and this report's calm framing ages badly.
There's also rate-path risk in both directions: a fast drop toward 5% would unfreeze buyers and sellers together, and nobody knows which wave would be bigger; years more of high rates would turn the freeze from a phase into a permanent reshaping of who owns, rents, and builds.
Why It Matters
Almost every confusing housing headline — record prices during an affordability crisis, realtors struggling in a "strong" market, builders thriving while sales stagnate — resolves once you see one market where the ability to transact, not the value of the asset, is what broke. The practical lesson: watch volumes, not just prices. Volume is where this cycle's story is being written.
What We're Watching
- Freddie Mac's 30-year rate sustained below 6% — the first level where meaningful unfreezing plausibly begins.
- Existing-home sales holding above a 4.5 million annual pace — a genuine thaw rather than noise.
- The share of outstanding mortgages under 4% in FHFA data — currently about half; as it erodes, the lock-in weakens.
- Months of supply pushing past six nationally — the point where sticky prices historically start to bend.
- The gap between new- and existing-home sales trends: narrowing means normalizing, widening means the freeze is deepening.
Sources: National Association of Realtors existing-home sales data; Freddie Mac Primary Mortgage Market Survey; S&P Cotality Case-Shiller Index; FHFA National Mortgage Database; Redfin turnover analysis. This is analysis, not investment advice.